
by Javantea
April 2, 2009
I've talked about graphing before and I don't have a lot of time to explain, but I thought I'd answer a friend's question of what my current project looks like. It looks like a upward sloping green blob with an exponentially decreasing slope.
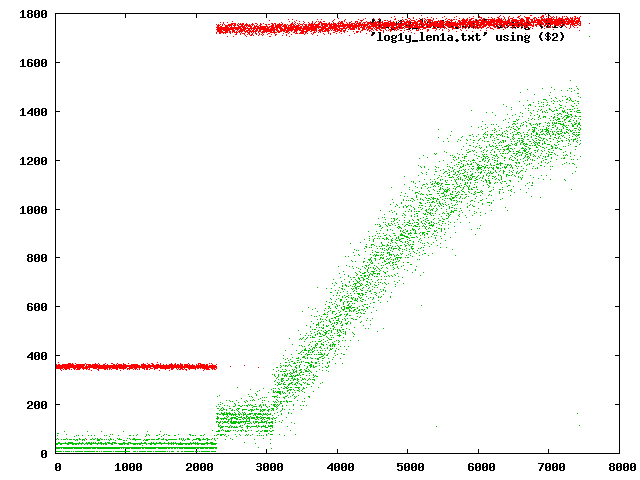
Sales graphs wish they were my green blob graph. Netmap 6 is a project to create a compete portscan of the internet. The green blob shows how I am improving the rate of finding responsive IPs from 11% (200/1800) to 78% (1400/1800). This rate reduces the time it takes to scan the internet by a factor of 7 approximately.
I used a script to generate the data for this graph obviously. I used gnuplot to plot the graph. When I decided to generate this graph, I was looking at a rather large bunch of data. You can tell by the number of dots and the large maximum on the x-axis. On the y-axis, you have medium size maximum. The graph doesn't show what the x-axis or y-axis represent. There are no units on either axis and yet the viewer understands it instantly. That's because it follows a pattern that engineers and laypeople know quite well -- over time, the green thing (whatever it is) increases in a perfect curve. The red thing on the other hand does not increase over time. A sales person might think sales vs time. A scientist might think of reactivity of two chemicals to produce an expected output. A computer programmer might imagine bugs fixed vs time. All these are examples of graphs that mean incredible progress. That's right, improvement over time.
Beyond the perfection of the curve, there are two things that make this graph even more exciting. You notice two green sections on the left that don't follow the curve. The first one on the far left happens to coincide directly with the red line being low. It does not improve over time at all. The second section looks like it might be an improvement, but if you notice that the red is multiplied, you can see that the green and red in this section is just a multiple of the first section. That's right, the first two sections do not improve at all over time.
What does this graph actually specifically mean? Each red is dot a set of ips that were tested. Each green dot is a set of ips that responded. The y-axis is the length of the line, so 1700-1800 on the y-axis = 100 ip addresses. In the curved section, the algorithm is learning to avoid IP addresses that do not respond. Each time a dot is printed, the data is gathered and the probability of making a mistake is reduced slightly. I designed it very specifically that the probability of any IP block would not go below 1/1000 so that very sparsely populated blocks get searched (although much slower than highly populated blocks).
I will post an essay with results on AltSci Concepts when they are ready. The topic of my essay is secret, though feel free to ask.
Permalink-
Leave a Reply


Comments: 0
Leave a reply »